Samuel Aguilar-Arguello, Wayne Schou, Ilze Pretorius
The ability to predict and prevent wildfires is important in safeguarding lives and property. In New Zealand, fire authorities use many tools to predict fire behaviour, one of these being the fire simulation software Prometheus. It was designed to provide near real-time operational decision support by predicting fire growth, and to evaluate the effectiveness of various fuel management strategies.
It achieves this by using geographical data, such as slope and elevation, as well as data relating to fuel and weather conditions. The software generates fire perimeters in both time and space, employing proven scientific principles.
Notwithstanding its sophistication, predicting fire behaviour remains a challenge, mainly because fire properties, including rate of spread, direction and intensity, depend on variables that interact in complex ways.
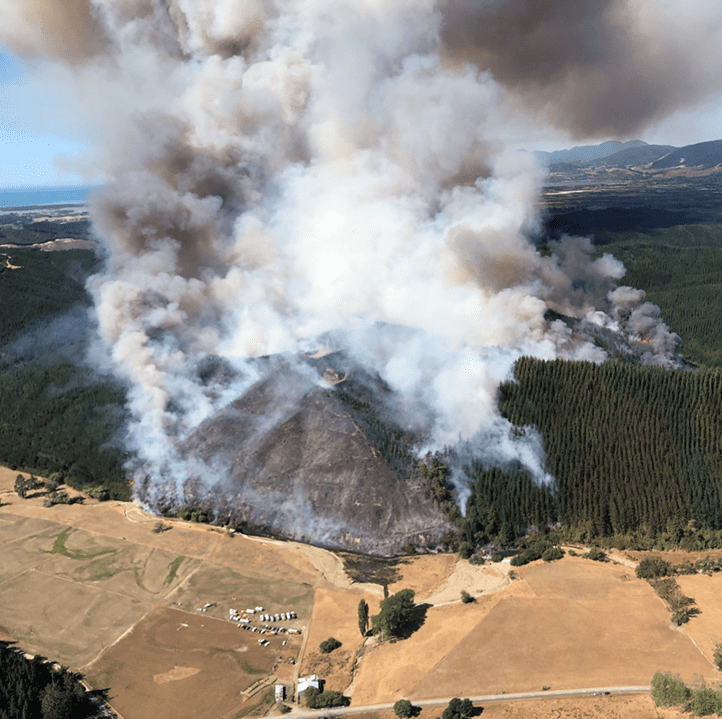
To assess the accuracy of the predictions generated by Prometheus, Scion fire and data scientists compared simulated outcomes under various input conditions with real-world scenarios. In this context, simulations were based on a well-documented wildfire incident in New Zealand, the Pigeon Valley fire, Tasman district in February 2019. This wildfire, which engulfed an extensive area of 2,300 ha across three days, is significant from the perspective of fuel management, as it stands as the most destructive plantation fire in the past 60 years. This event also caused the evacuation of about 2,500 residents from Wakefield and neighbouring small towns.
We ran five different simulations with Prometheus for the first eight hours of the fire. We wanted to compare simulated fire spread with real-world fire data.
Each simulation used slightly different information:
- Model 1: This used the very first data available when the fire started. Everything was set to default values with the starting point of the fire identified automatically from satellite hotspot information and weather conditions retrieved from the nearest weather station.
- Model 2: Similar to Model 1 but using the actual starting point of the fire.
- Model 3: Weather information was also replaced with gridded meteorology from 49 virtual weather stations.
- Model 4: The dryness level of the grass was then adjusted to make it more realistic.
- Model 5: And finally, the types of fuels were altered to account for changes to forested areas in recent years.
Each of the adjustments to default inputs improved the prediction accuracy.
Thus, Model 5 showed the most accurate fire growth modelling when it was compared to actual perimeters (Figure 2).
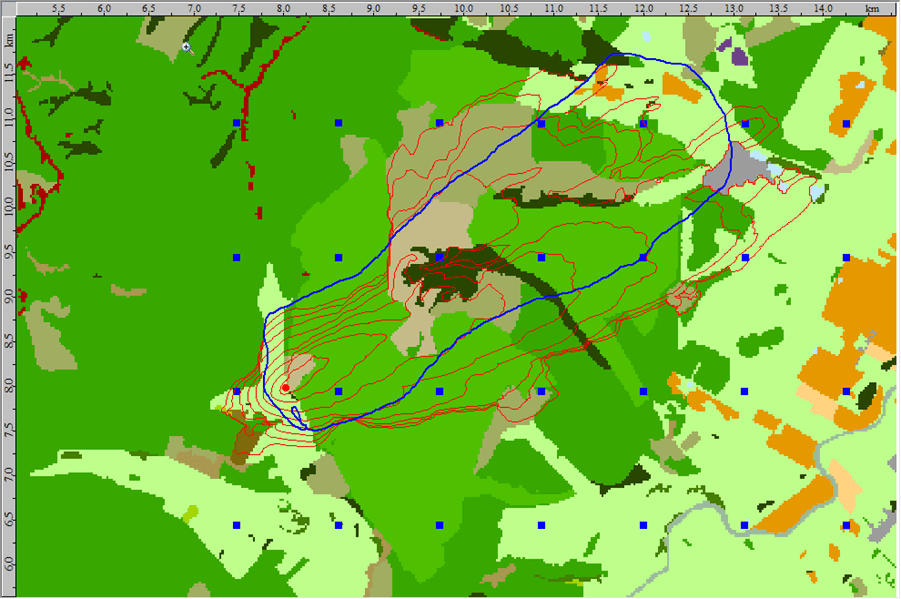
It is important to note that these fire growth models did not factor in any fire suppression activities, which helps explain why the modelled perimeters extended beyond the actual fire boundaries.
Furthermore, the simulations did not consider the phenomenon of fire spotting, where small fires ignite ahead of the main fire due to wind-borne embers. This can significantly impact the speed and shape of a wildfire. Observations suggested that fire spotting did occur during the Pigeon Valley fire.
For future research, the study suggests merit in exploring whether the use of gridded meteorological input data could lead to improved fire growth modelling results across a broader range of case studies. If proven effective, the adoption of gridded meteorological data is recommended for automated fire growth modelling tools like the New Zealand Fire Registry. This approach could enhance the accuracy and effectiveness of wildfire prediction and response in New Zealand – efforts that ultimately lead to safer, more resilient communities.
Acknowledgement
The authors thank Stuart Moore and Wolfgang Hayek, NIWA for the provision of gridded NZRCM meteorological data, Veronica Clifford and Tara Strand, Scion and Richard Turner, NIWA for reviewing the report. The Wildfire Intelligence and Simulation Engine (W.I.S.E.), used here for model simulations, was endorsed by the Government of the Northwest Territories, Canada. This research was funded by the Resilience to Nature’s Challenges National Science Challenge.
The full research report provides further details. Please contact Wayne Shou, Scion if you wish to discuss this research: Wayne.Schou@scionresearch.com