Mat Darling is a PhD student at the University of Canterbury funded by our Rural programme, and his research seeks to better understand the disaster risk exposure of tourists in New Zealand. Mat is using new data sources to track real time movements of tourists, in order to help emergency managers plan more accurately for natural hazard event response in tourist hotspots. Mat’s latest research uses data sensors to build a picture of peaks and lulls at key hotspots.
Mat picks up the story…
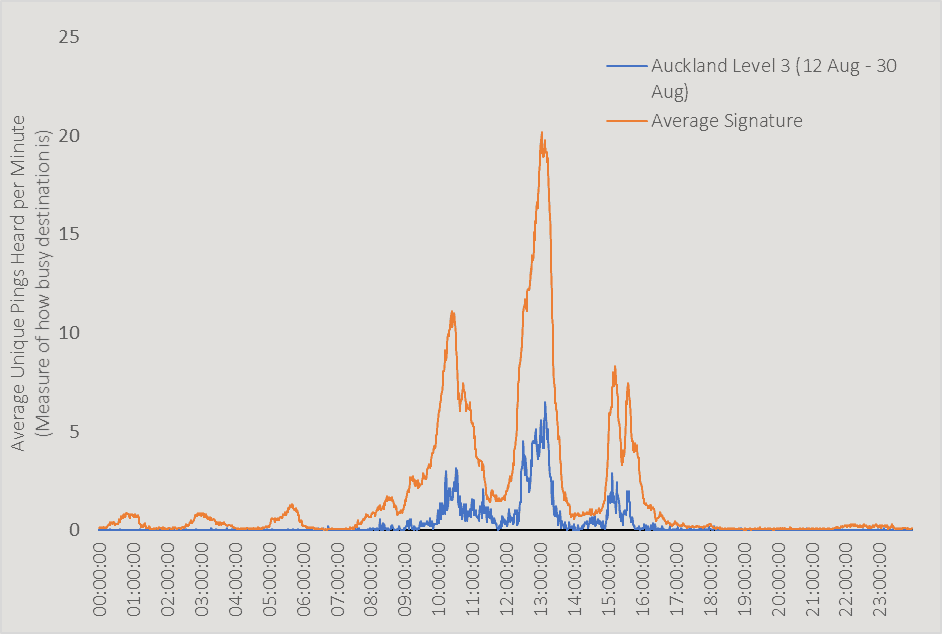
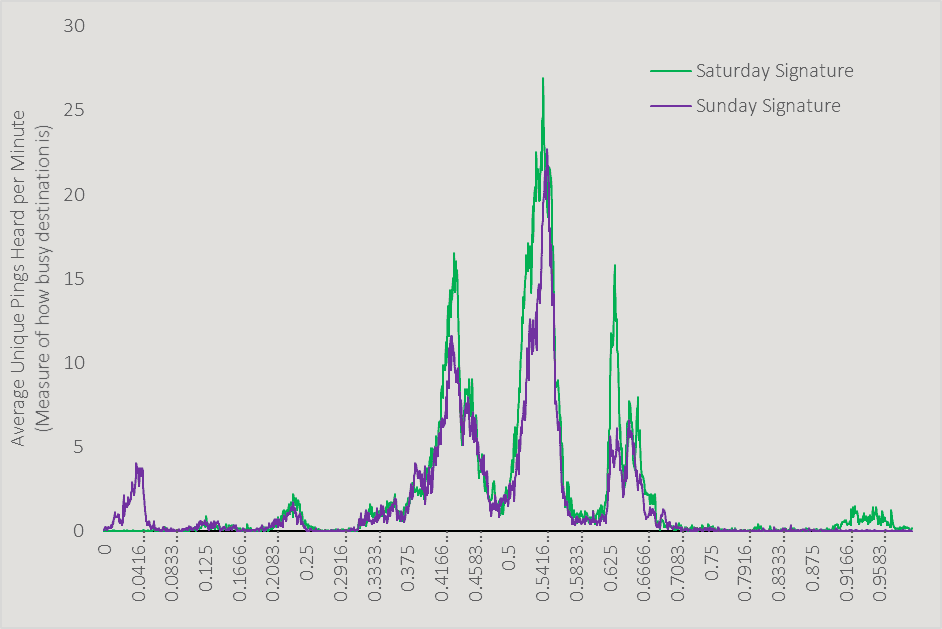
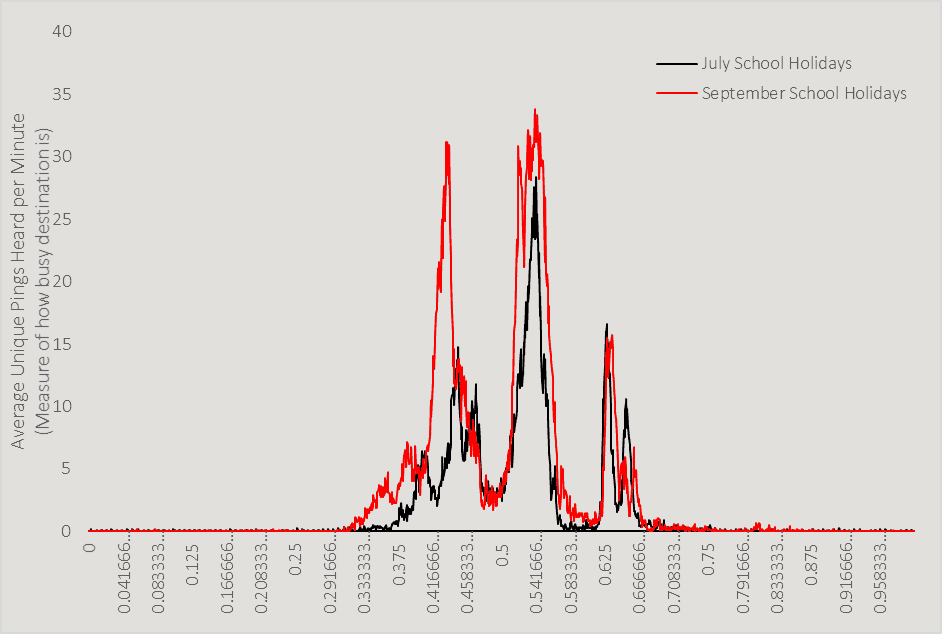
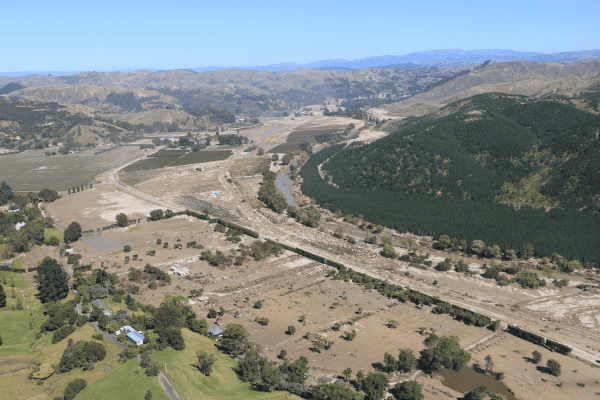
We have deployed a network of sensors which operate in a real time sense across key tourism hotspots of the South Island. We are moving towards a model that aims to characterise visitation throughout the course of the day under different scenarios (e.g. school holidays, public holidays, weekend vs weekday). This is fundamental to understanding how busy places may be during the course of a day, but where people may not traditionally stay overnight (e.g. Piopiotahi / Milford Sound), and using this information to inform disaster risk assessments in a dynamic sense.
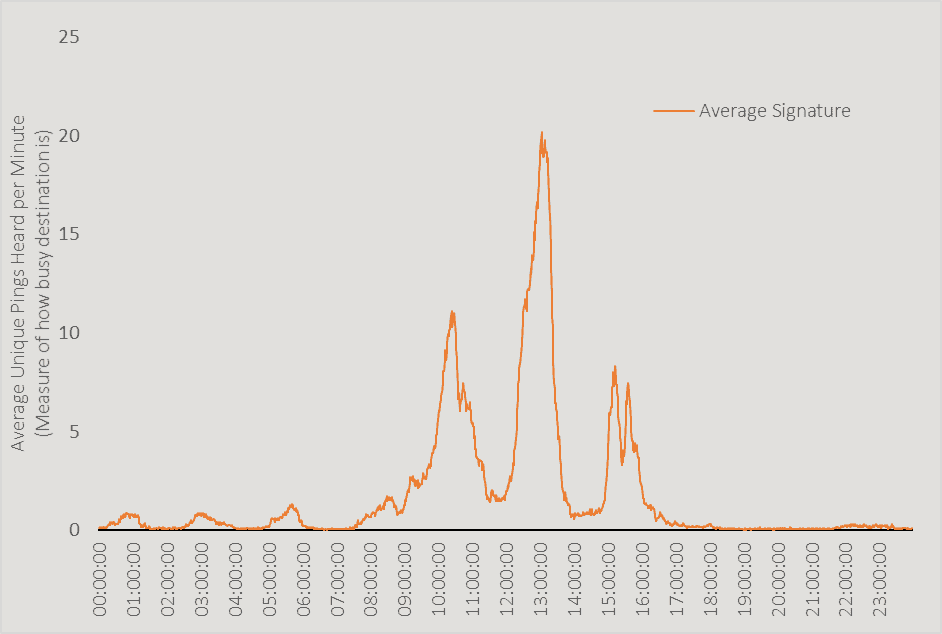
Through passively listening for anonymised wifi pings of a cellular device, we can begin to build a picture of how busy a place may be through the course of a day. Any device with wifi turned on will continuously send a ping looking for wifi network to connect to every minute or so. We can count the number of pings within a 100 – 200m range as a proxy for people in an area. With these signatures, we can begin to characterise and predict how different places may be occupied through the course of the day.
Below, is the ‘average’ day in Milford Sound since we began monitoring in May 2020. We can look at how this varies from ‘average’ across different days of the week, different COVID alert levels, or holiday periods.